

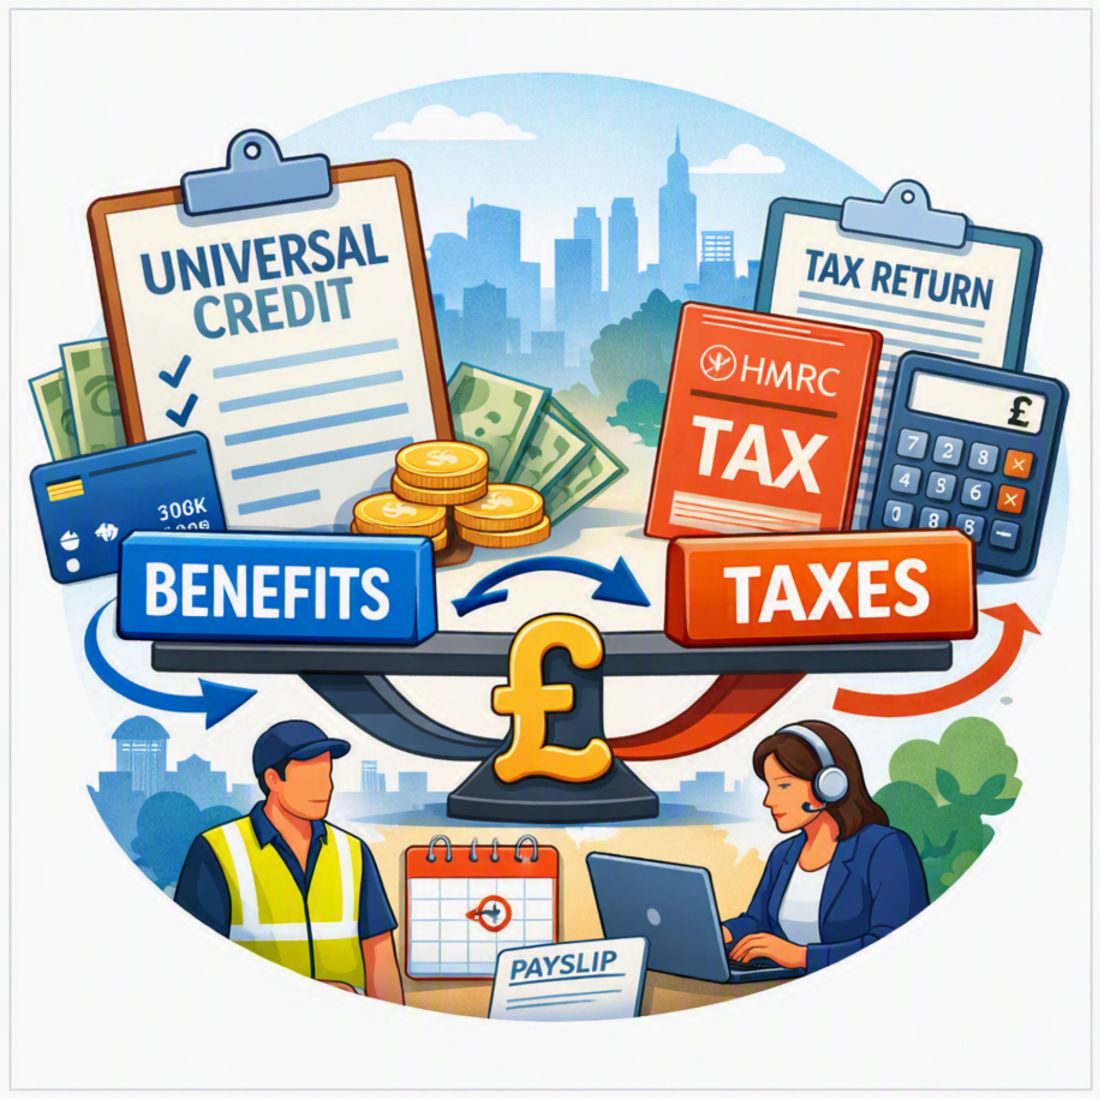
A plain-English worked example showing why a headline tax giveaway can become a much smaller household gain once Universal Credit is taken into account
Introduction: why headline tax cuts can feel different in household budgets
This paper examines a simple but often overlooked question: what happens when a headline tax cut meets the Universal Credit system in a real household budget?
It was written in response to Reform UK’s proposal to raise the income tax personal allowance to £15,000, with a longer-term ambition to reach £20,000. The proposal has been presented as a major gain for workers. For many taxpayers, that may be true in a straightforward tax sense. But for workers who also receive Universal Credit, the position is more complicated.
Universal Credit is designed to reduce as earnings rise. This means that when a worker’s take-home pay increases, part of that increase can be offset by a lower Universal Credit award. The worker is still better off, but not by the full headline amount.
The central finding of this paper is therefore not that the tax cut has no value. It does. The central finding is that the advertised gain can be substantially reduced by the benefit system, leaving both the worker and the public purse with only a modest net change.
The deeper issue is wages. If a person can work 40 hours a week on the statutory minimum wage and still need Universal Credit, then the benefits bill is not only a welfare problem. It is also a low-pay problem. Policies that adjust tax thresholds may improve the appearance of work incentives, but they do not by themselves solve the structural fact that full-time minimum-wage work may still fail to provide financial independence.
This report is intended for a broad readership. It avoids technical language where possible and explains each calculation step by step. The aim is to test a political claim against household reality: not what the policy sounds like, but what it actually leaves in someone’s bank account.
Executive Summary
This report tests a simple claim against a real household budget: whether a headline tax cut delivers the full advertised gain to a worker who also receives Universal Credit.
| Policy tested | Increase the income tax personal allowance from £12,570 to £15,000. |
| Worker tested | Single renter, working 40 hours per week on the April 2026 National Living Wage, receiving Universal Credit. |
| Headline tax saving | £40.50 per month. |
| Universal Credit reduction | £22.28 per month. |
| Actual household gain | £18.22 per month. |
| Main finding | The worker is better off, but remains on Universal Credit and receives less than half of the headline tax saving as additional disposable income. |
In plain English: the policy helps the worker, but it does not transform their position. The household remains dependent on Universal Credit, and the public purse recovers part of the tax cut through a lower benefit award. The deeper unresolved issue is that full-time work at the legal minimum wage can still require means-tested support.
Section 1: The household used in this worked example
This is a realistic illustrative case rather than a claim to represent every Universal Credit household. Actual entitlement depends on age, household composition, rent, Local Housing Allowance, health status, childcare, savings, deductions and assessment-period earnings.
- Single adult
- Renting in Cheltenham
- Working 40 hours/week
- April 2026 National Living Wage: £12.71/hour
- Gross annual income: £26,436.80
- Gross monthly income: £2,203.07
- Assumed age: 25 or over
- Household type used for UC work allowance: single adult with limited capability for work or another qualifying basis for a work allowance, and receiving help with housing costs
This person is working full time on the legal wage floor for workers aged 21 and over. That matters because this is not an example of unemployment or unwillingness to work. It is an example of someone already doing what the policy narrative asks them to do: working full time, paying tax and National Insurance, renting privately, and still needing means-tested support.
Sources and assumptions used. The National Living Wage figure of £12.71 per hour from April 2026 is taken from GOV.UK. The Universal Credit taper rate of 55p for every £1 of earnings is taken from GOV.UK guidance on Universal Credit and earnings. The April 2026 Universal Credit standard allowance used here is £424.90 for a single claimant aged 25 or over, based on Citizens Advice guidance on 2026 changes. The housing element is treated as an assumption and should be checked against the relevant Local Housing Allowance rate and the claimant’s actual eligible rent.
The key point is that the example assumes the worker qualifies for a Universal Credit work allowance. That is not true for every single adult. A person with no children and no limited capability for work would normally have no work allowance, which would make the Universal Credit reduction larger. The assumption used here is therefore not designed to exaggerate the result; if anything, it gives the tax proposal a clearer chance to show a positive household gain.
Section 2: Current position before the tax change
Income tax


National Insurance
(£26,436.80 − £12,570) × 8% = £1,109.34 per year = £92.45 per month
Net pay
£2,203.07 − £231.11 − £92.45 = £1,879.51 per month
Universal Credit
- Work allowance used in this example: £427 per month, because the claimant is assumed to qualify for a work allowance and to receive help with housing costs.
- Earnings above allowance:
£1,879.51 − £427 = £1,452.51
- UC taper (55%):
0.55 × £1,452.51 = £798.88
- UC before taper:
£424.90 standard allowance + £675 assumed housing element = £1,099.90
- UC after taper:
£1,099.90 − £798.88 = £301.02
Total income (current system)
£1,879.51 + £301.02 = £2,180.53 per month
Section 3: What changes under a £15,000 personal allowance
Income tax


Net pay
£2,203.07 − £190.61 − £92.45 = £1,920.01 per month
Universal Credit
- Earnings above allowance:
£1,920.01 − £427 = £1,493.01
- UC taper:
0.55 × £1,493.01 = £821.16
- UC after taper:
£1,099.90 − £821.16 = £278.74
Total income (Reform UK £15k)
£1,920.01 + £278.74 = £2,198.75 per month
Net gain
£2,198.75 − £2,180.53 = £18.22 per month
The worker keeps £18.22 more per month. That is a real gain, but it is far smaller than the headline tax saving because the Universal Credit award falls as net earnings rise.
The Exchequer recovers £22.28 per month through the lower Universal Credit award, but still gives up £40.50 per month in income tax. The net fiscal cost in this example is therefore £18.22 per month.
This is the central policy lesson. The tax cut does not simply transfer the full saving to the worker. Nor does it simply save the state money. Instead, the gain is split: part reaches the household, and part is recovered through a lower Universal Credit payment. The result is modest for both sides.
Section 4: Beyond the calculation – what the numbers mean in real life
The calculations in Sections 2 and 3 answer the immediate policy question. They show how much tax falls, how much Universal Credit falls, and how much extra money the worker actually keeps.
But the calculation alone does not fully explain the household reality. It tells us the worker is £18.22 per month better off, but it does not tell us whether that change is large enough to alter their financial position in any meaningful way.
This is why the paper now moves from arithmetic to interpretation. The next question is not simply, “Did the worker gain?” The answer to that is yes. The more important question is: “Did the policy create enough extra disposable income to reduce fragility, build independence, or move the household away from Universal Credit?”
To answer that, the paper uses a simple diagnostic framework. The diagnostic is not introduced as a second set of evidence competing with the calculation. It is a way of translating the calculation into plain-English questions about financial security.
The broader Impoverishment Index was created to examine the gap between positive economic narratives and lived experience at a national level. The Universal Credit version applies the same idea at household level: it asks whether a policy that sounds generous actually changes the lived financial reality of someone affected by the benefits system.
The diagnostic looks at four practical questions, followed by a separate narrative mismatch test:
- How much of the headline gain does the worker actually keep?
- How much of the gain is offset through the Universal Credit taper?
- How much of the household’s income is already committed to essentials?
- How much room is left to absorb shocks, save, or become financially independent?
- How large is the gap between the headline claim and the lived result?
In that sense, the diagnostic is not the main claim of the report. The main claim remains the worked calculation. The diagnostic simply helps readers understand why a real but modest gain may still leave the household financially constrained.
Section 5: Measuring the real household impact
By this point, the arithmetic has already shown the immediate result: the worker gains £18.22 per month, not the full headline tax saving. The purpose of this section is to ask what that means in practice.
A small gain can still matter. For someone living on a tight budget, £18.22 is not nothing. But public policy should also ask whether a change is large enough to alter the underlying situation. Does it reduce dependence on Universal Credit? Does it create breathing room? Does it help the household build savings, absorb shocks, or move closer to financial independence?
To answer those questions, this report uses a simple household impact diagnostic. It is called a diagnostic because it is not trying to produce an official poverty measure or a scientific ranking. It is trying to diagnose what the policy actually changes inside a monthly budget.
Where a score is used, it is only a shorthand for the explanation that comes before it. A higher number means the policy has created more real household resilience. A lower number means the household remains more financially constrained. The score is therefore a communication aid, not the evidence itself.
The 0–10 scale should be read in plain terms:
- 0–2: very weak household resilience; the policy does little to change dependence or vulnerability.
- 3–4: limited improvement; the household gains something, but remains materially constrained.
- 5–6: moderate improvement; the policy makes a noticeable difference, but does not resolve the underlying pressure.
- 7–8: strong improvement; the household is significantly more secure.
- 9–10: very strong improvement; the policy substantially changes the household’s financial position.
This means the reader should not treat the number as a standalone claim. The explanation in each subsection comes first; the score then summarises that explanation in a compact form.
1. How much of the headline tax gain does the worker actually keep?
The first question is simple: if the policy is advertised as a tax gain, how much of that gain actually reaches the household after Universal Credit adjusts?

Result: 4.5/10. The worker keeps 45% of the headline tax gain.
This means work and tax reduction do improve the household’s position, but less than half of the headline saving reaches the worker as additional disposable income.
2. How much of the gain is lost through Universal Credit?
The second question looks at why the headline tax saving does not reach the worker in full. Universal Credit is means-tested. As net earnings rise, the Universal Credit award falls. This is the taper mechanism.
- Tax: 20%
- NI: 10%
- UC taper: 55%
- Total: 85%

Diagnostic result: 1.5/10. This is low because only a small share of each additional pound meaningfully improves household living standards once tax, National Insurance and Universal Credit withdrawal are considered together.
This is not a cliff edge and it is not a punishment; it is the design of the system. But it does mean that headline gains are diluted before they reach the household budget.
3. How much income is already committed to essentials?
The third question asks whether the household has enough room in the budget for the tax gain to make a practical difference. This matters because £18.22 has a different meaning in a household with spare income than in one where most income is already committed before the month begins.
- Rent: £800
- Utilities + council tax: £200
- Food: £300
- Transport: £150
- Other essentials: £150
- Total: £1,600/month
Essentials ratio = £1,600 ÷ £2,180.53 ≈ 0.73
Score = 10 × (1 − 0.73) = 2.7
Diagnostic result: 2.7/10. This is low because around three-quarters of income is already committed to essentials, leaving limited room for savings, emergencies or ordinary financial resilience.
In this scenario, around three-quarters of monthly income is already committed to basic costs. That leaves little room for savings, emergencies, debt reduction, household replacement costs, or ordinary participation in social life.
4. How much room is left for unexpected costs?
The fourth question asks whether the household has enough margin to cope with normal financial shocks: a rent rise, a reduced shift pattern, a delayed payment, an unexpected bill, a broken appliance or a higher winter energy bill.
- Savings: < £500
- Debt repayments: ~£150/month
- High volatility: rent increases, UC reassessments, variable hours
Diagnostic result: 2/10. This is low because the scenario describes a household with little capacity to absorb disruption. This score is illustrative rather than directly measured.
Because this paper does not use verified household-level evidence about this individual’s savings, debts or monthly volatility, the Stability Deficit score is treated as a scenario assumption. It should not be read as a measured fact about any named person.
5. How large is the gap between the headline and the lived result?
The final question brings the diagnostic together. It asks how far the public-facing story differs from the result inside the household budget. In this example, the headline is a tax cut for workers. The lived result is a much smaller gain, continued Universal Credit entitlement and no major change in financial independence.
Core average = (4.5 + 1.5 + 2.7 + 2) ÷ 4 = 2.675
Inverted:
Narrative mismatch = 10 − 2.675 = 7.3
Diagnostic result: 7.3/10, reported separately. This indicates a large mismatch between the apparent generosity of the headline proposal and the modest improvement in household resilience shown by the worked example.
The narrative mismatch score is not included in the core Index average, because it is derived from the other scores. Reporting it separately avoids double-counting.
Overall result: the household remains financially constrained
Core diagnostic average = (4.5 + 1.5 + 2.7 + 2) ÷ 4 = 2.7
Interpretation: The overall diagnostic result is low because the underlying position has not changed very much. The worker is still working full time, still receiving Universal Credit, still facing high essential costs, and still left with limited space to build financial independence. The tax cut helps, but it does not transform the household’s financial reality.
The diagnostic supports the same conclusion as the worked calculation: the proposal produces a real but modest gain, while leaving the worker financially constrained and still dependent on Universal Credit.
Section 6: What the policy appears to do – and what the calculation shows
At headline level, a higher personal allowance sounds simple and attractive. It can be described as:
- “A tax cut for workers.”
- “A reduction in welfare dependency.”
- “A shrinking welfare bill.”
The worked example shows a more complicated but more honest picture:
1. The worker is better off, but not by the headline amount.
The tax cut increases net pay, but the Universal Credit award then falls. In this example, the worker keeps £18.22 per month from a £40.50 monthly tax saving.
2. The Universal Credit award falls because net earnings rise – not because the household has become independent of support.
The household still receives Universal Credit after the tax change. The lower award does not mean the worker has escaped benefit dependency; it means the benefit system has adjusted to their slightly higher net earnings.
3. Disposable income barely changes.
An extra £18.22 per month may still matter to someone on a tight income. But it is not a transformational change. It is unlikely, on its own, to provide financial independence, build resilience, or remove the need for Universal Credit.
4. The household impact diagnostic remains low.
The diagnostic result remains low because the underlying household pressures remain in place: high essential costs, limited slack, and continued reliance on means-tested support.
5. The Exchequer recovers more than half of the income tax cut through reduced Universal Credit.
The government does not save money overall in this example: it gives up £40.50 in tax and recovers £22.28 through lower Universal Credit, leaving a net fiscal cost of £18.22 per month.
This is the essence of the policy problem:
A tax policy can improve a worker’s position while still leaving their day-to-day financial security largely unchanged. If full-time minimum-wage work still requires Universal Credit, then the unresolved issue is not only tax or welfare design. It is the adequacy of wages themselves.
Conclusion: the real issue is not only tax – it is low pay
This paper shows why tax policy cannot be judged by headline figures alone. For a worker receiving Universal Credit, a higher personal allowance can increase take-home pay, but the benefit system then adjusts because Universal Credit is withdrawn as net earnings rise.
In this worked example, the worker is better off by £18.22 per month after the personal allowance rises to £15,000. The policy therefore helps, but only modestly. The worker does not receive the full headline tax saving, and the household remains on Universal Credit afterwards.
That matters because it reveals the elephant in the room. A benefits system cannot be expected to shrink sustainably if the legal minimum wage for full-time work does not produce financial independence for many households. In that situation, Universal Credit is not simply supporting people who are out of work. It is also subsidising a labour market in which work at the legal minimum can still leave people below the level needed to live independently.
- work can increase income, but the effective gain may be much smaller than the headline wage or tax change suggests;
- Universal Credit can provide important support, but it also reduces as earnings rise;
- tax cuts should be assessed using household-level calculations, not only the headline value of the tax reduction;
- public claims about making work pay are strongest when they show who gains, by how much, and after which benefit interactions.
The household impact diagnostic is therefore best understood as a translation tool. It takes a policy headline and asks what it means in a real household budget. Used carefully, it can make public debate more concrete, more transparent and easier for non-specialist readers to understand.
The conclusion is not that tax cuts are meaningless. Nor is it that Universal Credit should not taper as earnings rise. The conclusion is narrower and more important: headline tax changes are not a substitute for confronting low pay, high essential costs and the structural reasons why millions of working households remain reliant on means-tested support.
Methodological note
The calculations in this report use rounded monthly figures, so totals may differ by a few pence from payroll software, HMRC tools, DWP systems or a full benefits calculator. The worked example assumes no pension contributions, no student loan repayments, no benefit cap effect, no deductions for advances or sanctions, and no council tax reduction. It also assumes the person qualifies for a Universal Credit work allowance; a single adult with no children and no limited capability for work would not normally receive one. The figures should therefore be read as an illustrative policy test, not as personal entitlement advice.
Further reading and data sources
The Impoverishment Index: https://adamtugwell.blog/2026/05/29/the-impoverishment-index-a-report-on-the-widening-gap-between-official-economic-narratives-and-real-world-lived-experience/
Disclaimer
This report contains illustrative calculations intended to explain how changes to income tax thresholds may interact with Universal Credit awards under current UK welfare rules. All figures, examples and scenarios are provided for general information only. They do not constitute financial advice, legal advice, welfare entitlement advice or professional guidance.
Universal Credit entitlement varies according to individual circumstances, including household composition, age, disability status, childcare costs, rent, Local Housing Allowance, savings, deductions, assessment‑period earnings and council tax liability. The examples in this report use simplified assumptions to demonstrate the interaction between net earnings and the Universal Credit taper. Actual awards may differ from those produced by official Department for Work and Pensions systems, accredited benefits calculators or payroll software.
While reasonable efforts have been made to ensure accuracy at the time of writing, no guarantee is given that the information is complete, up to date or free from error. Policy details, thresholds and rates may change without notice. No liability is accepted for any loss, damage or inconvenience arising from reliance on the contents of this report. Readers should verify all relevant details using authoritative sources such as GOV.UK, Citizens Advice or qualified welfare and tax professionals.
The household impact diagnostic described in this report is a conceptual tool created for illustrative and educational purposes. It is not an official measure of poverty, financial resilience or welfare adequacy. Scores generated using this diagnostic are scenario-based and rely on assumptions that may not reflect any specific household’s circumstances.
This report does not endorse, oppose or promote any political party, policy or proposal. It is intended solely to support public understanding of how tax and welfare systems may interact in practice.

