Why the modern Establishment is a worldview, not a class – and why that makes it so hard to escape.
Introduction – The Establishment Is Not What People Think It Is
Everyone claims to know what “the Establishment” is. Politicians campaign against it. Commentators blame it. Voters distrust it. Reformers promise to dismantle it. Yet when pressed to define it, most people reach for different answers – government, elites, the civil service, the media, finance, the judiciary, universities, “the blob”, or some hidden network of insiders.
All of these interpretations contain fragments of truth – but none of them capture the whole.
The Establishment is also the “they” that appears in countless political conversations. When people say “they won’t allow it”, “they don’t understand”, “they’ve already decided”, or “they’ll never let that happen”, they are usually trying to describe a force that feels real but is difficult to identify.
When challenged to explain who “they” are, many people struggle – not because they are foolish, irrational or imagining things, but because they are trying to describe a worldview as if it were a group of people. They can see the effects. They simply lack the language to explain the mechanism.
That is what the word “they” often signifies: an awareness of power without a clear map of how that power works. It is a tell. People know, at some level, that something larger than any one minister, party, company or institution is shaping outcomes. The mistake is not sensing it. The mistake is assuming it must be a single hidden group rather than a shared operating system.
The real Establishment is a worldview. A way of thinking. A mental operating system.
It is not a group of people. It is not a secret bunker. It is not a coordinated conspiracy.
It is a belief system that has become so dominant, so embedded, and so pervasive that it shapes everything – including many of the people who think they’re fighting it.
The Old Establishment: A Visible Hierarchy
Historically, the Establishment was simple:
aristocracy
inherited power
the Church
the military
the judiciary
Whitehall mandarins
elite universities
old boys’ networks
It was a visible hierarchy. You could point at it. You could name it. You could see who was in and who was out.
This is the Establishment people still imagine – even though it no longer exists in that form.
The Modern Perception: A Spectrum, Not a Consensus
Today, people see the Establishment through very different lenses.
1. Those who benefit from the system
They see the Establishment as:
competent
stabilising
necessary
expert
responsible
They trust it because it works for them.
2. Those harmed or excluded
They see it as:
distant
unaccountable
elitist
opaque
indifferent
They experience its decisions as disconnected from real life.
3. Those who see conspiracy
They imagine:
puppet‑masters
hidden committees
coordinated elites
This is understandable – the system behaves in ways that look coordinated – but it is not accurate.
4. Those who think they’re outside but are actually inside
This includes:
anti‑establishment politicians
populists
disruptors
commentators
They believe they are fighting the Establishment. But their actions, not their words, reveal that they operate fully within its worldview.
This is not unique to one party, faction or ideology. A politician can denounce “the elites” while still judging success by market confidence. A newspaper can attack bureaucrats while still treating financial credibility as the final test of seriousness. A reformer can call for renewal while still assuming that centralised management, competitive funding, external consultancy and measurable outputs are the only acceptable forms of action.
The important point is not the behaviour of one individual, but the wider pattern: much of what presents itself as anti‑establishment politics is actually a more intense expression of the same underlying worldview.
5. Those who see clearly but cannot escape
Analysts, academics, journalists and reformers may understand parts of the system, but still live inside it.
Because unless you become an off‑grid hermit, you cannot avoid interacting with the Establishment.
It is not something you leave. It is something you wake up inside.
The Real Establishment: A Worldview That Saturates Everything
The modern Establishment is not a group. It is a belief system.
By “worldview”, I do not mean a formal doctrine or a book of rules. I mean a shared set of assumptions about what is realistic, responsible, credible, modern and possible.
A worldview is powerful precisely because it usually does not feel ideological to those inside it. It feels like common sense.
It is a worldview built around:
market primacy
financial credibility
growth as the unquestioned good
competition as the organising principle
state restraint
technocratic management
institutional self‑protection
distance from consequences
This worldview has become the centre of gravity for anyone who wants to succeed in politics, media, finance, business, or public institutions.
It is not enforced by conspiracy. It is enforced by incentives.
How the Establishment Was Captured: The Slow, Invisible Drift
The capture was not deliberate. It was not planned. It was not coordinated.
It was a slow drift driven by:
globalisation
financialisation
deregulation
privatisation
market‑centric policy design
media consolidation
think‑tank influence
political professionalisation
legislative entrenchment
Over decades, the worldview became:
normal
sensible
realistic
responsible
inevitable
This is cognitive capture – not a personal failing, but a structural condition.
Here, “capture” should not be read as a claim that one group seized control of everything. It is more subtle than that.
It is the process by which institutions, careers, policy choices and public language gradually align around the same underlying assumptions until alternatives appear naive, dangerous or unserious.
People didn’t choose the worldview. They inherited it. They were rewarded for it. They were insulated by it. They were promoted for it. They were praised for it.
It became the mental furniture of their lives.
Cognitive Capture – The Human Mechanism Behind the System
This is the part many of us may find hardest to accept. Not because it is an accusation, but because it asks us to recognise something uncomfortable: if we live and work inside today’s version of normal life, then we have almost certainly been shaped by the Establishment worldview in some way.
That does not make us foolish, corrupt or guilty. It makes us human. But it does mean that real change cannot begin while we continue to tell ourselves that everything is basically fine, or that the system is only temporarily out of sync, or that the problem is simply the wrong government, the wrong leader, or the wrong party.
Deep down, many people already know this is no longer enough. The unease is not just political disappointment. It is the recognition that something more fundamental has stopped working.
Cognitive capture does not mean people are:
stupid
corrupt
malicious
incompetent
It means:
The system shapes how people think, and they don’t realise it because it feels like reality.
Anyone can be shaped by a system this pervasive.
This worldview becomes:
familiar
rewarded
reinforced
socially validated
professionally required
This is why even intelligent, well‑intentioned people struggle to imagine alternatives.
And this is why telling people “you’re captured” feels insulting – because it sounds like saying they don’t understand their own world.
But the truth is gentler:
Everyone is shaped by the systems they inhabit.Some systems are just more pervasive than others.
The Anti-Establishment Paradox: Why Rebels Reinforce the System
This is one of the most important dynamics.
Many “anti‑establishment” actors:
use establishment logic
reinforce establishment incentives
pursue establishment definitions of success
rely on establishment structures
defend establishment assumptions
They think they’re outside. But they’re inside.
The paradox can be seen repeatedly in modern politics.
Many figures present themselves as insurgents, outsiders or challengers of the Establishment. They speak the language of disruption, renewal and rebellion. Yet when examined more closely, their proposed solutions often rely upon the same assumptions, incentives and measures of success that define the existing system.
In some cases, they are not challenging the Establishment worldview at all. They are intensifying it. They push its logic further, pursue its assumptions more aggressively, and then interpret the resulting resistance as evidence of conspiracy or institutional sabotage.
This is why anti‑establishment rhetoric is not the same thing as anti‑establishment thinking. Some of the people waiting in line to inherit power may be more deeply embedded in the worldview than many of the people who currently hold it.
This is the paradox:
People who think they’re outside are often the ones most deeply inside.
And the most chilling part:
Even those who can see the system clearly are still inside it, because the Establishment exists in the assumptions, incentives and institutions that shape ordinary life.
Unless you become a literal hermit, you cannot avoid interacting with it.
How the Establishment Works: The Operating System of Society
The Establishment operates through:
incentives
norms
legislation
finance
institutional culture
professional pathways
institutional memory
risk aversion
narrative control
This creates a self‑reinforcing loop:
The worldview shapes institutions.
Institutions reward conformity.
Conformity strengthens the worldview.
The worldview becomes invisible.
The system becomes fragile but self‑protecting.
Attempts to challenge it are absorbed or neutralised.
Anti‑establishment actors end up reinforcing it.
The worldview becomes even more entrenched.
It behaves like a deep state even though it isn’t one.
How the Establishment Shapes Everyday Life
The worldview defines:
housing
healthcare
education
wages
taxation
public services
infrastructure
media narratives
political debate
what counts as “affordable”
what counts as “possible”
what counts as “responsible”
People feel the consequences:
rising costs
stagnant wages
degraded services
insecure work
unaffordable housing
shrinking local government
political cynicism
social fragmentation
But they rarely see the worldview behind it.
This is why “they” is such a revealing word. People feel decisions arriving from somewhere, but the source is dispersed across policy, finance, professional norms, media narratives, institutional habits and inherited assumptions. The power is real, but it is distributed. It speaks through many mouths while often belonging to no single person.
This is where abstract language becomes concrete. Housing is not simply a market outcome; it is the result of land policy, credit conditions, planning rules, investment incentives and political tolerance for scarcity. Public services are not merely “inefficient”; they reflect choices about taxation, outsourcing, central control, workforce morale and what forms of care are valued. Local government does not shrink by accident; it shrinks when national systems treat local capacity as a cost rather than as democratic infrastructure.
Why the Establishment’s Belief System Has Reached Its Limit
The worldview appears to have reached its limit because:
the economic model is fragile
the social contract is fraying
public trust has weakened sharply
inequality has widened
services have degraded
infrastructure is under visible strain
markets are volatile
the worldview struggles to solve the problems it helped create
each crisis leaves the system with less room for manoeuvre
This is not merely a mood. Recent UK evidence points in the same direction: official statistics show that homes remain unaffordable for many households; public attitude research has recorded deep dissatisfaction with major services and low trust in governing arrangements; and income research has shown weak living‑standards growth across the period since the financial crisis and through the cost‑of‑living shock.
The system increasingly appears to be defending a model that is struggling to meet the challenges it claims to solve.
None of this proves that every institution is failing, or that every person inside those institutions is acting badly. That would be too crude. The point is narrower and more important: a worldview that promised efficiency, prosperity and competent management now struggles to explain why so many people experience the system as expensive, remote, fragile and unresponsive.
The Strongest Objection
The strongest objection to this argument is that what I am calling an Establishment worldview may simply be the unavoidable logic of a complex modern society. Perhaps advanced economies need expertise, central institutions, financial discipline, legal continuity and professional management. Perhaps markets, whatever their failures, remain the least bad way of coordinating activity at scale. Perhaps the alternative to the current system is not renewal, but chaos.
That objection deserves to be taken seriously. Expertise matters. Institutions matter. Stability matters. The answer is not to romanticise disorder or imagine that sincerity can replace competence.
But this objection only goes so far. The issue is not whether societies need institutions. They do. The issue is what assumptions those institutions are built around, who they are accountable to, what outcomes they privilege, and whether they remain capable of learning from failure. When expertise becomes detached from consequence, when stability protects dysfunction, and when “responsibility” means preserving a failing model, the language of competence becomes part of the problem.
Why Change Requires Awakening, Not Rebellion
Even if a crisis creates the conditions for paradigm change, nothing will change unless enough people:
see the worldview clearly
recognise its limits
recognise its harms
recognise their own participation in it
Otherwise they will:
circle back
rebuild the same logic
re‑establish the same hierarchy
re‑entrench the same worldview
People rebuild the cage from the inside.
Conclusion – The Establishment Is Not Something You Overthrow, It’s Something You Wake Up From
The Establishment is not a deep state. It is a worldview that saturates the entire system. People who think they’re outside are often deeply inside. Even those who see it clearly still have to interact with it. And this is why change is so hard – because the Establishment is not something you defeat, it’s something you outgrow.
Its belief system has reached its limit. The question now is whether enough people can see it clearly enough to imagine something better – not merely a different leader, party or slogan, but a different set of assumptions about how economies, institutions and communities should function.
That is why the direction of travel matters. If the Establishment is a worldview, then meaningful change has to be practical as well as intellectual. It has to ask how value is created locally, how decisions are made, how communities govern themselves, how money circulates, how public capacity is rebuilt, and how institutions become answerable to lived reality rather than insulated from it.
Whether that alternative succeeds is a separate question. But no alternative can emerge until the limitations of the existing worldview are recognised. Before systems can change, assumptions must change. Before new institutions can be built, people must first stop mistaking the existing model for reality itself.
Next Step
For a more practical exploration of the direction implied by this argument, see the following text on local economy and governance:
Declining trust, institutional fragility, and the danger of mistaking symptoms for causes.
Trust in political institutions is falling, public frustration is rising, and many people increasingly feel that politics offers different language but the same underlying direction. The slogans change. The faces change. The promises change. But the choices in front of us often seem to lead back to the same narrow set of answers.
This is why politics feels broken to so many people. It is not only because of scandal, incompetence, polarisation, or distrust, although all of those matter. It is because the political system itself appears to be losing its ability to adapt. Institutions feel brittle. Public debate feels repetitive. Outsider movements rise, but often carry the same assumptions as the establishment they criticise.
The risk of the moment is not simply anger, division, or frustration. It is misdiagnosis: the danger that a complex, systemic crisis will be treated as if it were a single problem with a single solution.
Why Does Politics Feel Broken?
Politics feels broken because people are experiencing several overlapping pressures at once: declining institutional trust, economic insecurity, cultural fragmentation, political polarisation, and a governing system that struggles to respond to complex problems. When these pressures are interpreted as one-dimensional failures – corruption, incompetence, weak leadership, or bad ethics – the proposed solutions rarely reach the deeper causes.
Collapse, in this context, does not mean sudden breakdown. More often it means the gradual loss of adaptive capacity: institutions becoming less able to absorb pressure, public trust becoming harder to sustain, and familiar political tools becoming less effective at solving emerging problems.
Why Everything in Politics Feels the Same
The political system is not just struggling. It is running out of room. Many parties, campaigns, and “new” options still draw from the same restricted deck: the same assumptions about markets, competition, growth, individual responsibility, and institutional management. That is why it can be difficult to see genuine daylight between them.
When a political system narrows, the public naturally looks elsewhere. Outsider movements become attractive because they sound fresher, less compromised, and more willing to say what established figures avoid. But unfamiliar is not the same as new.
Many outsider movements rise by naming real failures, but they often remain shaped by the same deeper instincts as the system they oppose. They may reject the tone of the establishment while keeping its underlying logic: competition as the default answer, market discipline as the main tool, and self-interest reframed as principle.
This is the restricted deck problem. A movement can appear disruptive on the surface while still being constrained by the same limited tools underneath. It can criticise the system without escaping the logic that made the system brittle.
The Perception Gap: Symptoms Are Easier to See Than Systems
Most people experience political crisis through its visible symptoms: arguments, scandals, headlines, personalities, broken promises, and day-to-day drama. These symptoms matter, but they are not the whole story.
The deeper problems are quieter. They sit inside institutions, economic pressures, cultural tensions, and the erosion of public trust. They do not fit neatly into interviews, slogans, or campaign messages, so they are often left unnamed.
This creates the perception gap: people feel system-level instability, but they mostly see surface-level conflict.
Someone may feel a loss of security and see only incompetence. They may feel institutional fragility and see only political theatre. They may feel economic pressure and see only blame. The deeper structure remains hidden behind the noise.
When people see only one dimension of collapse, they naturally look for one-dimensional explanations. They want someone who can point to a single cause and offer a single fix. That is why simple narratives are so powerful: not because they are accurate, but because they are comforting.
The danger is that people then choose solutions that match the part they can see. They try to fix a system problem with personality politics, institutional fragility with anger, cultural tension with slogans, and economic pressure with blame. None of these responses reaches the deeper causes.
Why Outsider Movements Rise – and Why They Often Fail
Outsider movements rise when established politics no longer feels capable of interpreting the moment. They gain traction because they appear to break the repetition. They speak plainly. They name frustration. They offer clarity when public life feels foggy.
But there is a crucial transition point when a movement stops being a protest and starts becoming a possible alternative. At that point it must evolve. It has to move from naming failure to understanding complexity, from expressing anger to building capacity, from opposing the system to explaining how a different system would work.
If it cannot make that transition, the opportunity is lost. The movement may still win attention, followers, seats, or headlines, but the deeper chance to change the direction of public life disappears.
When that happens, a vacuum opens. People remain frustrated, but the movement that could have organised that frustration into something constructive has failed to deepen. The space is then filled by movements that sound calm, confident, and certain – even when their certainty is built on oversimplification.
The Danger of Simple Explanations
Simple explanations become powerful in exhausted societies. They reduce complexity to a manageable story. They identify a culprit, promise a remedy, and make the future feel controllable again.
If people believe the crisis is only about ethics, they look for ethical heroes. If they believe it is only about incompetence, they look for competent managers. If they believe it is only about corruption, they look for clean hands. If they believe it is only about mismanagement, they look for stronger leadership.
All of these may be desirable. But none is sufficient on its own. A crisis of institutional trust, democratic legitimacy, economic pressure, and cultural fragmentation cannot be solved by fixing only one visible fault line.
This is how misinterpretation deepens collapse. The surface problem is addressed while the underlying system continues to lose capacity. The noise is treated, but not the structure. The drama is managed, but not the direction. The symptom is soothed, but the disease remains.
As research into political trust has repeatedly shown, declining confidence in representative institutions can make democratic systems more fragile and make it harder for governments to respond to shared problems. That does not mean every institution deserves automatic trust. It means that once legitimacy erodes, societies need more than better messaging. They need institutions capable of earning trust again.
What a Systemic Crisis Looks Like
A systemic crisis is rarely experienced as one dramatic event. It is more often experienced as a pattern: promises that do not land, institutions that struggle to absorb pressure, public debate that becomes more reactive, and citizens who feel that nothing quite changes even when everything seems urgent.
It can appear as declining trust in government, parliament, media, parties, expertise, or public administration. It can appear as polarisation, disengagement, cynicism, or the repeated rise of anti-establishment politics. It can appear as economic pressure being translated into cultural blame, or cultural anxiety being translated into institutional hostility.
The crucial point is that these are not separate stories. They interact. Economic insecurity weakens trust. Low trust makes compromise harder. Weak compromise makes institutions less effective. Ineffective institutions deepen frustration. Frustration creates demand for simple narratives. Simple narratives then make the system even harder to repair.
This is why the crisis feels larger than ordinary political disagreement. Democracies are built to contain disagreement. They are not built to function well when the public no longer believes the system can hear, process, or respond to pressure.
Seeing the Whole Picture
If the risk of the moment comes from misdiagnosis, then the way through begins with seeing the whole picture. Not the noise alone. Not the personalities alone. Not the scandals, slogans, or surface explanations alone. The task is to understand how institutions, economics, culture, trust, and political behaviour reinforce one another.
That does not require specialist expertise. It requires resisting the temptation to make the moment smaller than it is.
Once collapse is understood as multi-layered, the appeal of single-layer solutions weakens. One person cannot fix it. One party cannot fix it. One slogan cannot fix it. One moral diagnosis cannot fix it. A system problem requires system-level understanding.
This does not mean giving up on clarity. It means refusing false clarity. The strongest analysis is not the analysis that makes everything simple. It is the analysis that makes complexity understandable without pretending it has disappeared.
The greatest danger is not political disagreement. Democracies are designed to accommodate disagreement. The greater danger is misdiagnosis: treating a complex, systemic crisis as if it were a single problem with a single solution.
When societies misunderstand the nature of their challenges, they choose remedies that intensify the underlying condition. They mistake confidence for competence, simplicity for truth, and visibility for understanding.
Understanding the whole picture is therefore not a luxury. It is a prerequisite for responding effectively to the moment we are living through.
This paper is not written to demand agreement. It is written to make space for thought. Many people already sense that something in the current direction of travel is wrong: food systems feel fragile, technology feels increasingly distant from human value, and communities feel less able to shape the things that matter most. This work is for those people.
The aim is not to provide a closed model or a perfect answer. The aim is to introduce a practical doorway into a wider body of work concerned with EFCG, LEGS, Foods We Can Trust, local food resilience, Contribution Culture, and community capability.
The heavy horse proposition is deliberately visible because people need to be able to picture alternatives. It shows that the future does not have to mean either going backwards or being dominated by technology designed around control, extraction, and human replacement.
This is a serious proposal, but it is also an invitation. If it causes the reader to pause, question an assumption, or discuss a different possibility with someone else, it has begun to do its work.
Disclaimer
This publication is intended for informational, educational, and discussion purposes. It presents concepts, models, and proposals designed to encourage reflection, experimentation, and community‑level dialogue. It is not a technical manual, regulatory guide, or prescriptive instruction set.
The author has made every reasonable effort to ensure the accuracy of the information contained within. However, agriculture, land management, engineering, and community‑scale systems involve variables that differ widely across locations, conditions, and capabilities. Readers should exercise their own judgement, seek appropriate professional advice where necessary, and adapt ideas responsibly to their own circumstances.
Neither the author nor the publisher shall be held liable for any loss, damage, or adverse outcome arising directly or indirectly from the use, application, or interpretation of the material in this book.
Any references to external organisations, reports, or research are included for context and illustration. Their inclusion does not imply endorsement, affiliation, or responsibility for the content of this work.
This book is offered as a contribution to ongoing public conversation. It should be read as an invitation to think differently, not as a guarantee, prediction, or instruction.Executive Summary
The AI Age of Heavy Horse proposes a new class of hybrid agricultural and land-management machines that combine horse traction, electric assist, lightweight engineering, sensors, and AI-supported guidance.
These machines are not proposed as a universal replacement for tractors. They are proposed as one practical component within a wider capability system designed for soil health, local resilience, human participation, and reduced dependence on fragile external inputs.
The paper argues that modern agriculture has become highly productive but also highly dependent: on diesel, finance, global logistics, imported components, fertiliser, centralised processing, supermarket distribution, and distant decision-making.
This work therefore treats resilience as a design requirement. It asks what agricultural capability remains when ideal assumptions no longer hold, and what forms of technology can strengthen farmers, workers, animals, soil, and communities rather than replacing them.
Its central proposition is simple: technology should enhance human capability, not remove people from productive systems.
The horse is important because it makes the idea visible. It represents proven biological capability partnered with modern engineering. The wider principle is to take the best of what has been tested over time and combine it with the best of what modern technology can offer, under human-centred and locally accountable purposes.
This paper is one link in a broader architecture: An Economy for the Common Good, LEGS, Foods We Can Trust, community food capability, apprenticeship, local logistics, local processing, and Contribution Culture. It stands alone as a mechanisation brief, but its deeper purpose is to help open a different conversation about agency, freedom, food, technology, and human value.
Purpose
To introduce a new generation of horse-compatible agricultural and land-management machines that combine proven biological traction with modern engineering, electric assist, sensors, and AI-supported guidance.
These machines are designed to operate at human scale, protect soil, reduce dependence on fragile external inputs, and form one practical link within a wider interconnected capability system.
This is not a return to the past. It is retooling for a different economic paradigm: one in which capability, stewardship, community, and interdependence matter more than industrial scale, financial extraction, and supply-chain dependency.
The proposition is deliberately bold because the problem is serious. Modern agriculture has achieved extraordinary productivity, but much of that productivity now depends on fuel, finance, components, fertiliser, logistics, processing, and distribution systems that sit beyond the control of farmers and local communities. Efficiency and resilience are not the same thing.
This brief does not ask farmers, engineers, or communities to abandon progress. It asks whether progress has been defined too narrowly, and whether the next generation of technology should be designed to enhance human and local capability rather than remove people from productive systems.
In this sense, the work is both practical and symbolic. Practical, because machines, traction, soil, fuel, labour, processing, and logistics are real problems. Symbolic, because the image of a horse working with AI-supported machinery makes visible a third path: neither a retreat from technology nor surrender to a technology-dominated future.
Key Concepts
Hybrid Mechanisation Machines powered by horses + electric assist + AI guidance.
Capability Chains Interconnected local systems where each part strengthens the others (e.g., grain → mill → bakery → kitchen).
Human‑Scale Systems Tools and workflows designed for small farms, mixed terrain, and multi‑operator teams.
LEGS – The Local Economy & Governance System Community‑level decision‑making that replaces distant bureaucracy.
EFCG – An Economy for the Common Good A needs‑first, contribution‑based economic model where capability replaces wages.
These definitions are intentionally short. Each concept can be expanded elsewhere, but this brief uses them only to keep the reader oriented.
Capability is the central word. Money can purchase capability only when the systems that convert money into food, fuel, tools, labour, and logistics are still functioning. When those systems weaken, communities need the capability itself.
Respect for Capability
Farmers are among the most innovative and entrepreneurial people in the country. They make things work under pressure, with limited resources, and without downtime.
They are engineers, logisticians, problem‑solvers, and leaders – all at once.
The issue is not capability. The issue is system capture.
Farmers were pushed into a model built around:
bigger machines
bigger fields
bigger debt
bigger dependency
bigger fragility
They trusted systems that were presented as progress: larger machinery, greater output, tighter logistics, global sourcing, finance-led expansion, and supermarket-scale distribution.
Much of it worked while conditions were favourable. The problem is what happens when favourable conditions no longer hold.
This brief is not a criticism. It is an acknowledgement of what farmers are capable of once the system stops extracting their autonomy and starts restoring their capability.
System Capture
The industrial food system has boxed farmers into:
supermarket dependency
machinery finance traps
fuel dependency
monoculture economics
regulatory hostility
supply chain fragility
subsidy distortion
Farmers did not choose this from a position of freedom. They were cornered by incentives, contracts, debt structures, market access, regulation, and cultural pressure that made resistance difficult and sometimes impossible.
This mechanisation system is not designed merely to compete with the industrial model on its own terms. It is designed to provide working capability where the industrial model becomes too expensive, too brittle, too centralised, or too dependent on inputs that are no longer reliable.
The United Kingdom Food Security Report 2024 recognises food, water, energy, and transport as critical national infrastructure sectors, and describes the UK food supply chain as a set of interdependent systems exposed to shocks and stresses involving energy, labour, imports, logistics, climate, and economic pressures.
The point is not to dramatise risk. The point is to treat resilience as a design requirement, not an afterthought.
Failure Conditions That Make This Necessary
Adoption is unlikely to begin with enthusiasm. For many farmers, it will begin when the existing model stops delivering reliability, affordability, or autonomy.
Trigger points may include:
fuel scarcity
machinery immobility
border dependency failure
fertiliser shortages
supermarket supply-chain failure
debt becoming unserviceable
monoculture fragility
legislative paralysis
economic contraction
When these conditions converge, farmers and communities will need capability, not simply capital.
Money is only useful if there are working machines, available fuel, accessible parts, skilled people, functioning logistics, and food moving through the system.
This system is designed to preserve and rebuild capability under constraint.
Critical Supply Period: Community Capability Before Full Retooling
There may be a period – possibly months, possibly longer – where existing supply assumptions no longer hold, but full local retooling has not yet been achieved.
This is the most dangerous period because communities are still dependent on systems that may be disrupted while replacement capability is still forming.
industrial supply chains are disrupted
imports are restricted or delayed
fuel is scarce or unaffordable
machinery is idle or difficult to maintain
supermarkets cannot maintain normal supply
farming is retooling
communities must increase local food capability quickly
During this period:
households grow what they can
community gardens fill gaps
small farms produce essentials
early hybrid machines begin operating
horses provide land‑friendly logistics
local processing ramps up gradually
community kitchens stabilise food access
This is how communities bridge the gap between:
industrial disruption
local retooling
This mechanisation system is designed for that transition: not as a complete answer on day one, but as an early operating layer that helps farms, households, local processors, and community kitchens begin functioning together.
Land-Use Systems: Taking the Best of the Past and the Best of the Future
The mechanisation described in this brief does not stand alone. It is designed to work within land‑use systems that industrial farming sidelined:
regenerative farming
sustainable mixed farming
precision land management
permaculture principles
heritage soil‑care systems
These approaches are not distractions. They are structurally necessary for a resilient, localised food system.
Industrial agriculture dismissed them because they do not scale vertically. But this model scales horizontally, through:
community capability
interconnectivity
distributed labour
human‑scale mechanisation
regenerative cycles
mixed cropping
soil‑friendly traction
AI‑guided precision
This is not “going back.” It is moving forward with the best of the past and the best of the future.
The test is not whether a method is old or new. The test is whether it works, whether it can be maintained, whether it protects the land, and whether it strengthens human and local capability.
Soil: The Living Engine We Forgot
The future of farming does not begin with machines. It begins with soil – the living, breathing, biological engine that industrial agriculture has spent decades extracting from, compressing, sterilising, and exhausting.
Warnings about declining soil health are often framed as a countdown of harvests remaining. The stronger point is this:
The soil is not failing. The industrial model is failing the soil.
Soil is not dead. It is depleted – by:
heavy machinery compaction
monoculture extraction
chemical dependency
loss of organic matter
loss of microbial life
loss of structure
loss of stewardship
Industrial agriculture has treated soil as a substrate for inputs, not a living system.
The AI Age of Heavy Horse treats soil as the centre of the entire economic model.
Why Soil Matters to Hybrid Mechanisation
Hybrid horse‑AI machines are designed specifically to work with soil, not against it:
horses reduce compaction
lightweight frames protect structure
electric assist stabilises traction without weight
AI enables precision depth, spacing, and timing
modular tools suit mixed cropping
multi‑operator workflows allow careful land management
This is not nostalgia. It is engineering for soil health.
Research on soil compaction repeatedly identifies heavy machinery traffic as a significant cause of degraded soil structure, increased bulk density and penetration resistance, reduced porosity, poorer water movement, restricted root development, and yield loss.
A lighter, soil-centred mechanisation model therefore deserves attention not because it is quaint, but because soil structure is productive infrastructure.
A Flat Hierarchy: Human + Technology + Animal
The future is not:
human versus machine
machine replacing human
machine replacing animal
It is:
Human + Technology + Animal working together in a flat hierarchy.
Each contributes what it does best:
Horses provide land‑friendly traction and biological integration.
Humans provide judgement, care, creativity, stewardship, repair, training, and community.
Technology provides precision, optimisation, coordination, safety support, and information.
This partnership is not romantic. It is a design principle. The purpose of technology is not to remove people from productive systems, but to improve the quality, safety, effectiveness, and dignity of human contribution.
This is a central distinction. Current AI and automation are often funded and directed by objectives such as labour reduction, control, concentration, and financial return. That does not make technology inherently harmful. It means the purpose of technology must be changed.
In this model, AI and electrics support farmers, teams, animals, soil, and communities. They do not replace them.
This is not anti-technology. It is pro-human technology. It asks who defines the purpose of innovation, who benefits from it, who becomes dependent on it, and whether it increases or reduces real freedom.
Solution: Hybrid Horse-AI Mechanisation
This proposal does not assume that horses are universally superior to tractors. They are not. Modern tractors outperform animal traction in many high-power, large-scale, time-critical applications.
The question is different: can a hybrid system combining biological traction, lightweight engineering, electric assist, sensors, and AI-supported guidance provide valuable capability under conditions of rising input costs, soil pressure, energy constraint, supply uncertainty, and local retooling?
That is an engineering question, not a nostalgic one.
A new generation of machines built around:
horse traction
electric assist
lightweight modular frames
sensor arrays
AI‑guided operation
multi‑operator workflows
regenerative land principles
These machines:
stand on their own
solve real engineering problems
operate at human scale
reduce dependency on fuel
reduce dependency on industrial supply chains
increase meaningful labour
integrate into a wider capability system
This is hybrid mechanisation, not retro nostalgia. The horse is not the whole answer. It is a visible, practical expression of a wider principle: use the right capability for the task, whether that capability is human, biological, mechanical, electrical, or digital.
The image matters because people need to be able to see the alternative. A horse beside a modern machine carrying sensors, batteries, safety systems and AI guidance is difficult to fit inside the usual categories. That is precisely the point. It interrupts the assumption that the future must be either industrial automation or primitive retreat.
Interconnectivity: One Link in a Larger Chain
This mechanisation system is not isolated. It is part of a multidimensional, interconnected capability network.
Example chain (illustrative, not prescriptive):
A horse‑assisted machine harvests grain.
A carrier rig moves grain to a local mill.
A battery van delivers flour to a baker.
A community kitchen feeds people.
Compost cycles back to the fields.
Fields feed the horses.
Horses power the machines.
Every component stands alone. Every component interlocks. Every component strengthens the others.
This interconnectivity is the survival mechanism during the critical supply period and the operating principle of the longer-term localised economy. The aim is not isolated self-sufficiency on every farm or in every household. The aim is networked capability.
Engineering Opportunity
This is a new engineering frontier because it does not begin with the assumption that bigger, heavier, faster, and more autonomous is always better.
It begins with a different design question: what machinery is needed when soil health, local repairability, human participation, fuel constraint, animal welfare, and distributed production are treated as core requirements?
New Machine Directions (Conceptual, Not Final)
hybrid cultivators
AI‑guided seed drills
lightweight regenerative ploughs
multi‑operator harvest platforms
woodland extraction rigs
modular carrier frames
soil‑health monitoring implements
These are directions, not finished designs.
A serious development pathway would begin with reference machines rather than finished products: prototype platforms that can be tested, measured, criticised, improved, and adapted by farmers, engineers, horse handlers, soil specialists, and local manufacturing teams.
Reference Machine Questions
Any credible prototype programme would need to answer practical questions before wider adoption:
What field operations are most suitable for hybrid horse assistance?
What drawbar loads, operating speeds, and working widths are realistic?
How much electric assist is useful before weight becomes counterproductive?
Which tasks are best handled by the horse, the operator, the machine, and the AI layer?
How should safety systems protect horses, operators, apprentices, and bystanders?
Which components can be manufactured, repaired, or adapted locally?
How should soil health, compaction, fuel displacement, labour quality, and reliability be measured?
What animal-welfare standards, training systems, rest cycles, and handling protocols are required for ethical and reliable use?
What evidence would be sufficient to persuade practical farmers that the system is worth trialling?
Modern Materials
composites
lightweight steels
recycled alloys
shock‑absorbing polymers
Electric Assist
torque support
braking
stability
hill assist
safety systems
Sensors + AI
depth control
soil feedback
route guidance
load balancing
training support
Multi-Operator Workflows
Industrial machines often isolate the operator and concentrate capability into expensive, specialist equipment.
Hybrid machines use teams because the goal is not to remove people from the work.
The goal is to make the work safer, more skilled, more learnable, more productive, and more connected to the land.
The exact number of people depends on:
land
capability
community structure
machine class
season
We do not present fixed labour numbers here. We present a design direction: human capability is not a cost to be eliminated; it is a capacity to be developed.
Trigger Points for Adoption
Farmers will not adopt this system because it is novel. They will adopt it if it solves problems that the existing system can no longer solve.
Trigger points include:
fuel scarcity or volatility
machinery downtime
supply-chain disruption
supermarket failure or rationing
border closure or import instability
debt pressure
labour availability
community necessity
This is structural realism. The proposal is not that every farm should immediately replace tractors with horses. The proposal is that serious work should begin now on hybrid capability systems that can operate when diesel, finance, spare parts, logistics, and centralised food distribution become unreliable or unaffordable.
It also recognises that adoption will not be uniform. Some farms may never use this model. Some may use elements of it only for specific tasks. Some communities may develop shared equipment, shared horses, or local service teams. The purpose is not ideological purity. The purpose is practical capability.
Human-Scale Workflow
A small farm under this model:
uses hybrid machines
employs multi‑operator teams
integrates apprentices
shares capability across community nodes
connects to local processing
connects to local distribution
connects to local consumption
closes loops through regenerative cycles
Work becomes:
meaningful
contributive
skilled
social
structurally necessary
Not employment in the narrow wage-system sense. Capability.
This matters because labour has been treated for generations as something to reduce. In a money-centric system, fewer people can mean higher margins. In a capability-centred system, the question changes: how do we make necessary work better, safer, more skilled, more social, and more valuable to the community?
When a Basic Living Standard is secured through the wider economic system, the meaning of work also changes. Contribution is no longer reduced to survival wages. People participate because their contribution is useful, recognised, skilled, and connected to the real needs of the community.
This is why the document links mechanisation to the wider LEGS and EFCG work. A human-centred machinery system cannot fully succeed inside an economic culture that treats people primarily as costs and communities primarily as markets. It requires a wider shift towards contribution, capability, needs-first design, and local accountability.
Where This Brief Sits in the Larger System
This brief is one link in a chain that includes:
hybrid mechanisation
local logistics
local processing
regenerative land cycles
community kitchens
apprenticeship systems
local governance (LEGS)
needs‑first economics (EFCG)
Each link stands alone. Each link interlocks. Each link strengthens the others.
This brief is the mechanisation link. It should be read alongside the wider work on LEGS, EFCG, local food resilience, community production, apprenticeship, logistics, and needs-first economic design.
The wider lexicon is not intended to impose a single final model. It is intended to give people language, principles, guardrails, and practical examples that help them take back responsibility for the things that actually matter: food, shelter, energy, water, skills, health, governance, dignity, and community.
What This Paper Is Asking For
This paper does not ask the reader to accept every claim, adopt every concept, or abandon existing systems overnight. It asks for something simpler and more powerful: to think differently.
It asks farmers to consider where real autonomy has been lost, and where it might be rebuilt.
It asks engineers to consider machinery designed around soil, people, animals, and local repairability rather than only speed, scale, and automation.
It asks communities to consider food not as a retail product, but as foundational capability.
It asks technologists to consider whether AI should be judged by what it removes from human life or by what it helps human beings do better.
Power begins with thinking differently. Not because thought alone is enough, but because no serious change can begin while the existing paradigm remains invisible, unquestioned, and assumed to be inevitable.
Closing Statement
This mechanisation system is not designed for the world as it is assumed to be. It is designed for the world as it may be becoming: more energy constrained, more supply-chain exposed, more locally dependent, and more in need of practical capability.
It respects farmers by recognising their skill. It respects engineers by presenting a real design challenge. It respects horses by treating them as partners, not relics. It respects technology by asking it to serve humanity. It respects soil by placing it at the centre of the system. It respects communities by giving them a way to build capability before crisis removes choice.
It is hard. It is practical. It is testable. It is necessary to begin before it is needed. And if the assumptions behind this work prove wrong, the outcome is still worthwhile: healthier soil, stronger local skills, more resilient farms, better tools, and technology used in service of people rather than in place of them.
This paper is therefore not an ending. It is a doorway. Its purpose is to place an image, an argument, and a possibility into a space where many people already feel the need for another way but have not yet seen one clearly enough to discuss.
Evidence Notes
The argument in this paper is supported by several recognised areas of evidence and policy concern. The United Kingdom Food Security Report 2024 describes food security as dependent on supply-chain resilience and identifies the food chain as exposed to shocks and stresses across energy, labour, water, imports, logistics, climate, and business conditions. It also reports the UK’s production-to-supply ratio at 62% for all food and 75% for indigenous foods in 2023.
Official statistics on Energy use on farms in England 2023/24 report that red diesel was used by 98% of farm businesses within the Farm Business Survey population, making fuel availability and price a structural issue for agriculture rather than a marginal operational detail.
Research reviews on soil compaction identify heavy agricultural machinery traffic as a major contributor to degraded soil structure, increased bulk density and penetration resistance, reduced porosity, poorer water movement, restricted root development, and yield loss. These findings support the case for lighter, more soil-sensitive machinery systems where they are practical.
Reports on future farm fuels also recognise the difficulty of replacing diesel in larger agricultural machinery through battery-electric systems alone, especially where battery weight, charging infrastructure, energy density, and long working days create practical limits. Hybrid systems and smaller, lighter, task-specific machinery therefore deserve serious development attention.
These notes do not prove the whole proposition. They show that the concerns behind it are not imaginary: food-system interdependence, fuel dependency, soil degradation, and technology choice are already recognised as serious issues. This paper brings them together under a human-centred capability frame.
Further Reading
The following readings are arranged to help the reader move from the wider system architecture into the practical food, community, and technology themes that support this paper. They are not required background, but they provide the conceptual scaffolding behind the terms used here: LEGS, EFCG, Contribution Culture, Basic Living Standard, Foods We Can Trust, and human-centred AI governance.
1. System Architecture and Local Governance
The Local Economy & Governance System https://adamtugwell.blog/2025/11/21/the-local-economy-governance-system-online-text/ This is the primary companion text for understanding LEGS: the local decision-making, coordination, and accountability framework that sits behind the wider capability model. It helps explain how local food, work, production, welfare, and governance could be organised around community need rather than distant market or bureaucratic control.
An Economy for the Common Good https://adamtugwell.blog/2025/02/24/an-economy-for-the-common-good-full-text/ This text sets out the broader economic paradigm behind the paper: a needs-first, capability-centred alternative to wage dependency, extraction, and market-led social organisation. It is useful for readers who want to understand why this mechanisation proposal is framed as part of an economic transition rather than simply a farming technology idea.
The Basic Living Standard Explained https://adamtugwell.blog/2025/10/24/the-basic-living-standard-explained/ This piece explains the social foundation that makes contribution culture possible: a secure baseline of food, shelter, care, energy, transport, and essential participation. It is relevant because this paper’s view of work depends on people being able to contribute without survival pressure reducing every activity to wage necessity.
2. Food Security, Local Production, and Community Resilience
Foods We Can Farm, Catch, Harvest and Grow Locally in and Around the UK https://adamtugwell.blog/2025/07/18/foods-we-can-farm-catch-harvest-and-grow-locally-in-and-around-the-uk/ This practical reference supports the local-production side of the argument by identifying food types that could form part of a more regionally grounded food system. It helps readers connect the abstract idea of food resilience to real crops, harvests, fisheries, livestock, and growing possibilities.
Grow Your Own or Home Growing https://adamtugwell.blog/2025/07/31/grow-your-own-or-home-growing/ This reading brings the resilience conversation down to household and community scale. It is useful for readers interested in the critical supply period discussed in this paper, where gardens, small plots, community growing, and local food skills help bridge the gap before larger systems have fully retooled.
The current paradigm is persuasive because it has shaped the incentives, institutions, language, technology, media, and expectations that surround daily life. Most people are not wrong to have trusted it. They have lived inside it.
But systems are not inevitable. They are built, maintained, funded, defended, and repeated until they appear natural. The first step in changing them is not agreement. It is the ability to imagine that another way of organising life, work, food, technology, and community might be possible.
The AI Age of Heavy Horse is offered in that spirit: not as a finished answer, but as a serious image of a different future – one where technology serves human value, food systems rebuild local agency, work regains dignity, and communities recover the capability to shape the things that matter most.
Imagine being denied a tenancy, a job interview, a loan, or access to a basic service by a system no one can properly explain.
No person takes responsibility. No clear reason is given. There is no meaningful appeal. You are simply scored, sorted, and excluded.
That is the practical fear beneath the debate about artificial intelligence. Not just that machines may become powerful, but that they may be deployed inside systems already built to distance decision-makers from consequences.
For years, we have heard warnings about AI – existential threats, job displacement, democratic disruption. Politicians speak about it as if it is an emergency unfolding in real time. Yet when it comes to meaningful regulation, almost nothing happens.
Instead, political attention is channelled into social-media moderation and online harms: visible, emotive issues that leave the deeper structures untouched.
This contradiction is not a mystery. It is a symptom of something older and more uncomfortable:
The guardrails that would have made AI safer were dismantled long before AI arrived.
AI is not the original cause of our vulnerability. It is the mirror showing how vulnerable we already were.
I. The Myth That Technology “Moves Too Fast”
We are often told that AI is difficult to regulate because it evolves too quickly. But the truth is simpler, and far more revealing.
The problem is not simply that AI moves too fast. The deeper problem is that the UK has lost much of the institutional capacity needed to govern powerful technologies in the public interest.
Over decades, the state was hollowed out in ways that often sounded efficient at the time. Expertise was outsourced. Regulators were asked to do more with less. Public institutions became dependent on consultants, contractors, and private-sector systems they did not fully control.
The result is not simply a slow state. It is a state that has become structurally dependent on some of the same interests it is supposed to scrutinise.
In a system like this, everything looks too fast. Not because it is, but because the institutions meant to govern it were deliberately stripped of the ability to do so.
This matters because regulation is not just the act of passing a law. It requires expertise, enforcement, independence, funding, technical understanding, and the confidence to say no to powerful actors.
Without those foundations, even well-intentioned rules become symbolic.
II. AI Entered a System Already Designed for Extraction
AI did not land in a neutral landscape. It entered a political and economic system already shaped by forty years of:
Deregulation
Privatisation
Outsourcing
Financialisation
The weakening of labour, environmental, and consumer protections – including the growth of work models that blur employment status and shift risk onto workers
These were not isolated policy choices. They were part of a coherent ideological project:
To free markets from the constraints that protect people, communities, and the environment.
That project changed not only who owned services, but how problems were understood. Social needs were reframed as markets. Public responsibilities became contracts. Citizens were increasingly treated as customers, users, claimants, data points, or risks.
Labour protections are a clear example. In the gig economy and other insecure forms of work, the issue is not simply that people are paid too little. It is that the relationship itself is often structured to avoid responsibility. Workers may be treated as independent enough to carry the risks of the job, but not independent enough to set prices, negotiate terms, build security, or exercise real control.
This is how employment status becomes a loophole. Costs that should sit with the employer – downtime, equipment, insurance, holiday, sickness, pensions, training, scheduling instability, and the risk of fluctuating demand – are pushed onto the worker.
The language is flexibility. The reality is often underpayment with extra responsibility attached.
AI fits easily into that model because it can manage, rate, allocate, monitor, and discipline workers at scale while keeping formal accountability at a distance.
A person can be controlled by a platform, priced by an algorithm, penalised by a rating system, and still be told they are not quite an employee in the traditional sense.
The result was a system where:
data became a commodity
people became resources
public services became markets
corporate actors shaped policy
accountability became optional
In such a system, any powerful technology becomes risky – not simply because of what it can do, but because of where it lands, who controls it, and whose interests it is asked to serve.
This is why AI cannot be understood only as a technical issue. It is also a governance issue, an economic issue, and a question of power.
III. Why Social Media Gets Regulated Instead
Social-media regulation is politically convenient because it is visible, emotive, and easy to explain. It offers recognisable villains, clear examples of harm, and a public debate that fits neatly into news cycles.
It also focuses on behaviour more than power. It asks what people are allowed to say online, but less often asks who owns the systems, who profits from them, who audits them, or who is harmed when automated decisions spread into housing, work, finance, welfare, policing, health, and education.
That does not make social-media harms unimportant. It means they are easier for politics to confront than the deeper structural reforms that remain politically off-limits.
Meanwhile, the real issues – data governance, algorithmic accountability, labour displacement, surveillance, power concentration – remain untouched.
The same narrowness appears in the labour debate. We talk about productivity, automation, and skills, but less often about who carries the risk when platforms classify workers as flexible contractors while directing their work through software.
This is why the public debate can feel strangely narrow. We argue about harmful posts, but not about automated welfare decisions. We debate online speech, but not the ownership of the data used to classify citizens, workers, tenants, borrowers, and patients.
IV. The Political Class Was Not Selected for Systemic Responsibility
Most politicians do not see the contradiction clearly because the political system rarely selects for that kind of responsibility.
The Westminster pipeline rewards:
communication
loyalty
campaigning
message discipline
It does not reward:
systems thinking
regulatory literacy
long‑term governance
understanding of political economy
understanding of technology
These skills matter in politics, but they are not the same as governing complex systems. Winning power and using power responsibly require different capacities.
This helps explain the shock of office. Leaders may arrive with conviction, but then discover the scale of the machinery around them: private contracts, fragmented responsibilities, legacy systems, institutional inertia, and a political culture designed for message control rather than long-term stewardship.
The result is a politics that can describe crises fluently but struggles to rebuild the institutions needed to prevent them.
V. The Deeper Guardrails: Distance, Centralisation, and Dehumanisation
Beneath the political and economic layers lies a deeper shift: decision-making has moved further away from the people affected by it.
1. Centralisation created distance
When decisions were made locally, decision‑makers lived among those affected. They had to look consequences in the eye.
Centralisation – and later globalisation – changed that.
Now decisions are made:
in London about people in Cornwall
in New York about people in Newcastle
in Singapore about people in Sheffield
by algorithms about people they will never meet
Distance dissolves accountability. It allows decisions to be made without ever encountering the human cost.
That distance does not automatically make people cruel. It makes consequences easier not to see. And what is not seen is easier to ignore.
2. Globalisation hid the extraction
Globalisation dispersed responsibility.
It created a world where:
supply chains are opaque
ownership is labyrinthine
accountability is diffused
harms are exported
profits are centralised
Power became global. Accountability remained local.
3. The digital revolution turned distance into dehumanisation
Digital systems do not see people.
They see:
risk profiles
credit scores
behavioural patterns
demographic segments
optimisation targets
This is why exclusion can now happen instantly, automatically, invisibly, and without meaningful recourse.
A person may experience this as a rejected application, a higher insurance quote, a closed bank account, a fraud flag, or a risk score they are never allowed to inspect.
The language is technical, but the consequence is ordinary: life becomes harder, and no one is accountable.
This is the point at which distance becomes dehumanisation. The person is still there, but the system no longer has to encounter them as a person.
AI did not invent this dehumanisation. It accelerated it.
VI. Finance and Creditworthiness: The Quiet Architecture of Control
The financial system is one of the clearest examples of guardrails removed, because it already decides who can participate fully in society.
credit scoring is privatised
risk modelling is proprietary
trading algorithms operate beyond oversight
access to finance is controlled by private gatekeepers
Creditworthiness has become a quiet tool of social sorting.
For many people, creditworthiness now functions less like a narrow financial measure and more like a passport to ordinary life.
It can determine:
who can rent
who can buy
who can work
who can move
who can access services
Because the system is largely self-policing, people can be excluded without ever fully understanding why. The companies making those judgements can hide behind commercial confidentiality, proprietary risk models, or automated decision-making.
AI supercharges this exclusion – making it faster, more opaque, and more difficult to challenge.
VII. The State Now Subsidises the Extraction It Cannot Control
As life becomes more unaffordable, the state steps in with:
housing benefit
universal credit
tax credits
energy subsidies
childcare subsidies
But these are not only social protections. They are also, indirectly, subsidies for a system that extracts more from people than many can afford to lose.
The state is paying to keep people afloat in an economy designed to drain them.
This is why public spending rises even as public wellbeing falls.
When wages, rents, energy costs, childcare costs, debt, and insecure work pull in the same direction, the state is forced to compensate for the damage while leaving the underlying model intact. In effect, public support can end up cushioning a labour market where too much risk has been transferred from employers to workers.
VIII. The System Has Become Too Embedded to Correct Itself
This is the uncomfortable truth.
The system cannot be corrected by slogans, ethics panels, or narrow technical fixes alone. It is too embedded, too centralised, and too dependent on extraction to repair itself without deeper political choices.
Even many of the technology leaders driving the digital revolution express fear about where this is heading – yet the machinery continues, because the system rewards momentum more than restraint.
We have built a world where:
power is concentrated
accountability is diffused
decisions are automated
consequences are invisible
people are abstracted into data
profit outranks wellbeing
In such a world, AI is not a disruption. It is the logical next step.
That does not mean nothing can be done. It means the solution cannot be limited to regulating individual tools after they have already been deployed.
The deeper task is to rebuild the conditions under which powerful tools can be governed in the public interest.
IX. The Reckoning
The reckoning is uncomfortable because it reveals that today’s risks were not inevitable. They were created by choices – political, economic, and ideological – made over decades.
But discomfort is not despair. It is clarity. And clarity is the first step toward rebuilding the protections we dismantled.
AI forces this recognition because it compresses old failures into visible form. It makes weak accountability faster, opaque decisions broader, and distant power harder to challenge.
X. The Paradigm Shift We Need
We cannot regulate AI – or housing, finance, labour, welfare, education, health, or the environment – within a system that continues to prioritise extraction over wellbeing.
We need a shift from a money-centric model to a people-centric one. That must not mean another abstract slogan. It should be a practical test for every major decision: does this system increase human agency, democratic accountability, and material security, or does it simply make extraction more efficient?
That means rebuilding practical guardrails that people can feel in everyday life:
regulators with the capacity and independence to act
public expertise that is not permanently outsourced
democratic oversight of systems that shape people’s lives
data rights that give people visibility, control, and meaningful protection
financial accountability when credit, risk, or automated systems exclude people
local decision-making where proximity to consequences matters
institutional responsibility that cannot be hidden inside contracts or algorithms
clear rights of appeal when automated systems affect people’s homes, work, money, services, or freedom
employment protections that prevent firms from using status, platforms, or algorithmic management to transfer employer responsibilities onto workers
AI is not the problem. It is the test.
And it is showing us, with painful clarity, that the guardrails we need are the ones we removed long ago. Rebuilding them will require more than better software or better speeches. It will require institutions capable of seeing people again – and strong enough to act when they do.
Further reading
These pieces expand the practical framework behind the argument above. Together, they explore how AI could be governed around human sovereignty, how local economies could be made more accountable, and how a basic living standard could give policy a clearer measure of real human security.
There are political moments when the noise briefly clears and the real problem underneath becomes visible. This is one of them. Not the daily drama, not the personalities, not the tactical argument of the week, but the deeper truth:
UK politics is now operating inside constraints so tight that real deviation risks bringing the whole structure down.
The issue is no longer simply that governments disappoint people. It is that government itself has increasingly nowhere to go. There is too little fiscal space, too little executive capacity, too little institutional resilience, and too much fragility built into almost everything the state now touches.
That is why the current political situation matters so much. The promises still sound large. The rhetoric still suggests choice. The next election still appears to offer a reset. But the system any government would inherit is already so tightly wound that the space between promise and reality has almost disappeared.
This is not just a story about Labour, the Conservatives, Reform, or any other party waiting for its turn. It is a story about a system that has exhausted the productive base, social resilience and institutional slack it once relied on, while still pretending politics can carry on as if those foundations remain intact.
The present moment is not a reset
The danger is that we keep reading each new political moment as a fresh beginning: a new leader, a new party, a new slogan, a new set of promises. But the deeper pattern is now harder to avoid. Each actor enters the same machinery, meets the same limits, and is then judged as if those limits were personal or partisan failures.
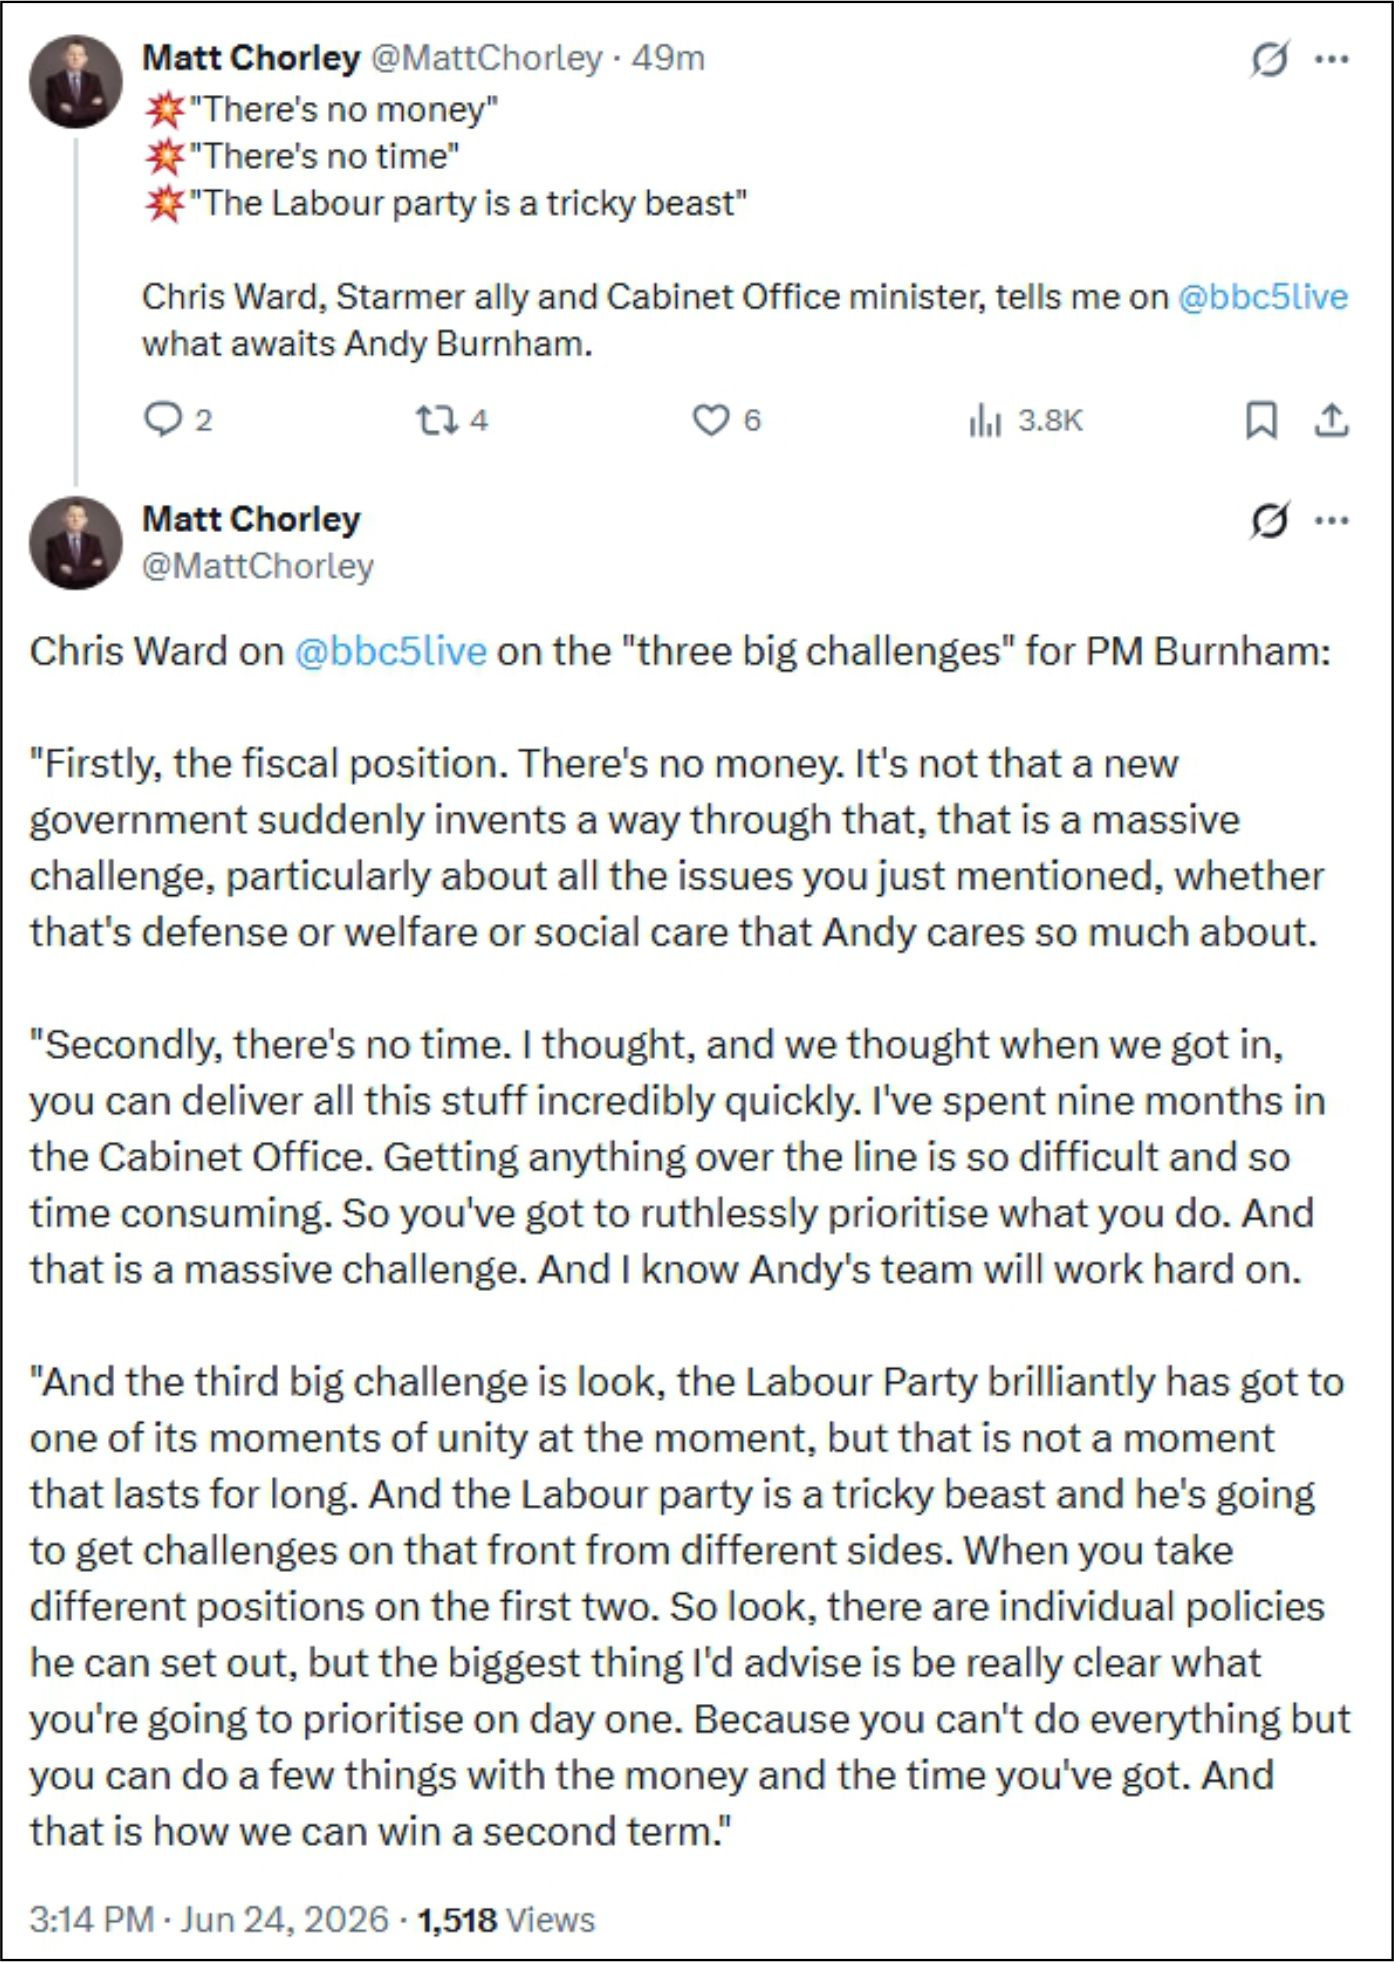
That is why recent honesty from inside Labour matters. Not because it reveals something uniquely damaging about Labour, but because it says out loud what every recent government has encountered, and what every future government will encounter unless the system itself is confronted.
The system is now the constraint
There was a time when governments could survive their own contradictions because the country still had enough spare capacity to absorb them. There was enough productive depth, enough institutional memory, enough social resilience, and enough fiscal room to muddle through.
That space has gone.
What remains is a money-centric, extractive system that has treated real productivity as something to be consumed rather than renewed. It has hollowed out capacity, captured too much of what once created value, and left the state managing consequences it no longer has the strength to resolve.
That is why the problem now feels different. It is not just that politicians face difficult choices. It is that almost every serious choice now carries a chain reaction.
Cut spending too hard, and social stability breaks.
Raise taxes too far, and the remaining productive base strains.
Borrow too much, and market confidence becomes a constraint.
Reform too quickly, and overloaded institutions fracture.
Every lever is now attached to something else. Every promise is surrounded by consequences. Every attempt to move decisively risks exposing how little room remains.
This is what politicians discover as they get closer to power. From the outside, politics still looks like choice. From the inside, it looks increasingly like constraint management.
That is the truth the public is not being told clearly enough.
The politician’s dilemma
This leaves every ambitious politician with the same dilemma.
To reach power, they must still sound as though change is available on familiar terms. They must offer energy, direction, confidence and action. They must persuade voters that the next government can do what the last government failed to do, even as the system they hope to inherit is leaving less and less space for any of it.
That is why policy language often becomes slippery at this stage of the cycle. It sounds like change to the untrained ear, but often reflects the reality facing a politician close enough to power to see the limits clearly: announcements narrow, promises become conditional, radicalism becomes sequencing, and transformation becomes delivery reform.
Burnham’s recent positioning matters in that context. The precise policies are less important than the direction of travel. The language still needs to sound active and ambitious, but it is increasingly shaped by the reality that awaits anyone who gets the keys to Number 10, or gets close enough to understand what those keys actually mean: no money without consequences, no reform without resistance, no easy cut that does not land somewhere human, and no decisive move that does not set off movement elsewhere.
That reality has faced successive governments. It is now facing this one. It will face the next one too. The pattern is brutally simple: they arrive promising movement, meet the constraint, narrow the promise, and are judged as if the constraint did not exist.
Only now, the cycle is compressing.
The honesty people are likely to misread
When Matt Chorley shared Chris Ward’s remarks on BBC 5 Live, the thread was instantly read as a comment on Labour’s internal challenges. The emojis, the shorthand – “no money, no time, tricky party” – made it sound like a partisan critique.
But the full exchange pointed to something bigger: a rare, candid description of the structural limits of government itself.
Ward wasn’t talking about Labour’s competence.
He was describing the physics now facing anyone who governs.
“There’s no money. It’s not that a new government suddenly invents a way through that – that is a massive challenge…
Secondly, there’s no time… Getting anything over the line is so difficult and so time‑consuming…
And the third big challenge is unity – that’s not a moment that lasts for long.”
Most people will hear that and think:
“Labour are struggling.”
But what he’s actually describing is the reality any government now faces.
The Conservatives hit the same wall – they just pretend they didn’t.
Labour are hitting it now.
Reform will hit it next.
The way the quote circulated online – stripped of context and reduced to emojis – is part of the problem. We keep mistaking structural reality for partisan failure. We keep reading honesty as weakness. We keep treating each turn of the wheel as a new story, when it is often the same system taking different actors back to the same place. And we keep missing the bigger message hiding in plain sight: the system itself is leaving government with nowhere to go.
That is what is killing what remains of our politics.
Why the next election may not resolve anything
There is a real chance that the current government is forced back to the country sooner than expected, or at least begins that process before the year is out. But even if that happens, it will not change the underlying reality.
Another election may change the personnel. It may change the mood. It may produce a different parliamentary arithmetic. It may even bring a Reform-led government, with or without a majority.
But it will not create room that does not exist.
The hardest truth is that no party can spend what the system no longer generates, cut what society now depends on without consequence, or restructure the state at speed without triggering effects elsewhere.
This is where much of the current rhetoric becomes dangerous. Bold plans appeal because they name real frustrations. But naming the frustration is not the same as creating capacity.
Large-scale fiscal shifts, rapid cuts, aggressive restructuring or dramatic executive action all assume that the system still has shock absorbers. It does not.
That is why another election could easily be followed by another crisis of legitimacy. A new government may arrive claiming a mandate to break the pattern, only to discover that the mandate does not change the machinery.
If the gap between promise and delivery opens quickly enough, the country could find itself back at the ballot box far sooner than anyone expects.
Why PR would not be the answer either
At that point, pressure for proportional representation may become overwhelming. That would be understandable. If people feel the system has failed repeatedly, they will look for a deeper democratic reset.
But PR would not answer the deepest problem.
It may improve representation, make Parliament feel more plural, and break the old duopoly completely. But it would not rebuild state capacity, restore productivity, create fiscal headroom, make overloaded services resilient, or reverse decades of extraction from the real economy.
PR changes how political power is distributed. It does not change the fact that the state is trying to do too much with too little, that too many people rely on systems already close to failure, or that the economic base beneath government has been weakened.
It would change the seating plan. It would not fix the building.
Why Reform would meet the same wall
Reform matters here because it may become the next major test of the illusion that political will is enough.
Its appeal is not mysterious. It speaks to people who feel ignored, overtaxed, under protected and patronised by a political class that has repeatedly failed to deliver.
Much of that frustration is real, and Reform offers urgency, clarity, punishment of the old order, and the feeling that someone might finally do something.
But urgency is not capacity.
Clarity is not room to manoeuvre.
A mandate, however large, cannot repeal the consequences of a system that has become too brittle to absorb shock.
Slashing benefits may sound attractive to people who do not currently need them. But benefits are not just a moral or fiscal question. In the country we have actually built, they are also holding back pressures created by wages that no longer allow many people to live independently, housing costs that absorb too much income, and services already stretched beyond design.
Pull that support away too quickly and the result is not simply savings. It is homelessness, crisis demand, public health pressure, social disorder, family breakdown, and costs reappearing elsewhere in the system.
That is what happens when the minimum wage is not enough for independent life, essentials become extraction points, and the state is left subsidising the consequences of an economy that no longer provides secure ground beneath people.
Reform would not escape that. No party would.
The deeper economic failure
This is why even the language of rescue now feels misleading. In the 1970s, an IMF intervention could still be understood against a country with a different productive structure beneath it. There were still industrial capacities, business forms, social expectations and economic relationships that could be reorganised around recovery.
Today, too much has been financialised, outsourced, consolidated and captured by systems that extract value rather than renew it.
That does not mean recovery is impossible.
It means recovery cannot be delivered by pretending the old tools still work in the old way.
The country has not simply run out of money. It has run out of the productive and institutional slack that once made political promises survivable.
That is the deeper reason government now has nowhere to go. It cannot easily tax, borrow, cut, spend, reform or delay without making another part of the system worse.
The global thread is even thinner
And all of this is before we even widen the lens.
The domestic system is already stretched thin. But it is not operating in a vacuum. It is exposed to energy shocks, market shocks, geopolitical escalation, supply-chain disruption, climate impacts, migration pressures, technological upheaval and the instability of a global order that itself looks increasingly brittle.
Any one of those could snap the thread.
That is why the political debate feels so unreal.
We are still arguing as if the question is which team can manage the old model better.
But the old model is the thing now failing.
Where this leaves us
If there is a thread running through all of this, it is that we keep mistaking political rotation for political escape. We change the faces, the slogans and the electoral maths, while leaving the underlying system untouched.
But the system is no longer merely inefficient. It is closing in.
That is why no one in UK politics today can escape it. Not because they lack ambition, slogans, advisers, strategies, reforms or mandates, but because the space those things require no longer exists in the way we pretend it does.
Another election may accelerate the reckoning. A Reform government may expose it. A push for PR may follow it. A fiscal crisis may sharpen it. A global shock may detonate it.
But none of those things, by themselves, fix the underlying problem, because none of them rebuild the productive, institutional and social capacity the system has consumed.
The system is not simply failing to deliver the future politicians keep promising. It is consuming the capacity that would be needed to build one.
Until that is faced, every election will feel like change, every government will promise movement, and every cycle will tighten – not because we chose the wrong people, but because we never changed the system they were stepping into.