It’s strange what you start thinking about when you are awake and unable to sleep in the small hours of the morning.
One thing that has been fascinating me (for all the wrong reasons) is just how committed our politicians and public figures are to the idea that the National Minimum Wage is enough for someone on a basic full time wage to live on, with the unspoken suggestion that anyone who can’t manage on that must be some kind of financial delinquent.
The journey to discovering truths can be a rocky one. Especially when you uncover the data that makes the argument for whoever you disagree with. That is, until you then take the series of steps and start looking beyond what they believe, based on what they have said.
Today, the National Minimum Wage is £10.42 per hour, for an adult of 23 years of age or older.
The question I really wanted to answer was ‘How is it our legislators are so confident that they are right about this rate – which in turn becomes the benchmark upon which the UKs basic standard of living is calculated?
The Average Living Rate
There’s a lot of data available through the Internet (Although I would strongly suggest doing the research for yourself rather than using AI if you want to try this).
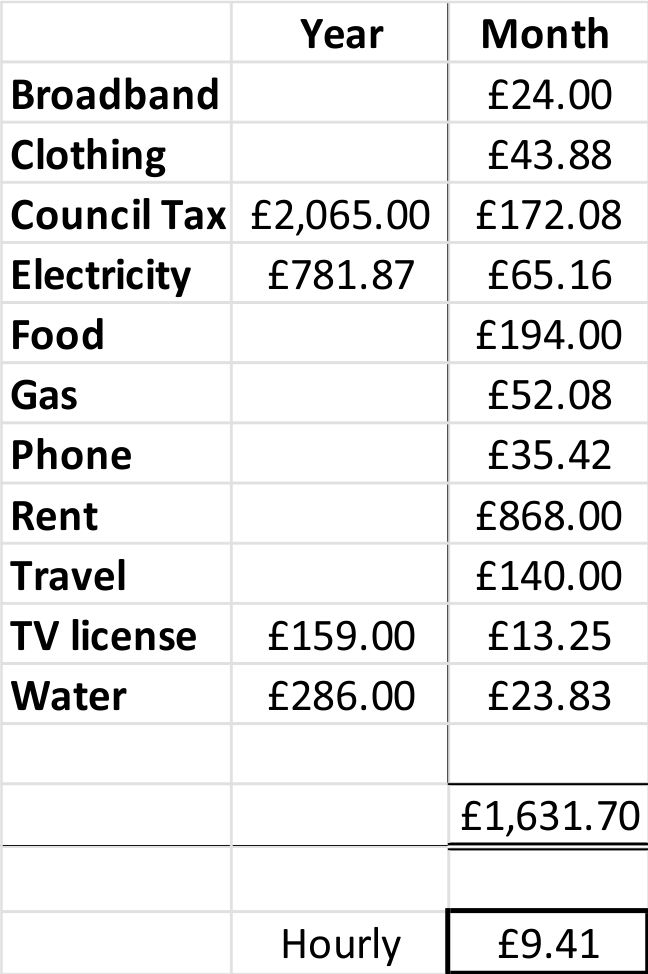
On an Excel Spreadsheet, I set out a list of all the key expenses that a single person would need to cover – without the added extras like holidays and big beer accounts. I looked up all the relevant figures for the average spend if you are a single person, and then did the maths to work out how much a single person on a basic, minimum or living wage needs to earn every hour, without deductions, to cover those costs, for themselves.
Initially, this was the point where I had that moment and thought ‘Are these people actually right: Do they have a point?’.
The figure I reached, based on a person working a 40 hour week, was £9.41, which with a National Minimum Wage rate of £10.42 per hour, would mean that person would have £1.01 per hour SPARE, if they were only on Minimum Wage.
But then I thought a little more.
As I said, my sums for these figures is based on the accepted average costs for travel, utilities, phones, food, clothes, rent and all you need, adds up to the grand total of £9.41 per hour, for a 40 hour week.
So, the reality that this calculation indicates a single person on a Minimum Basic Wage has £40.40 SPARE per week, certainly made me understand where our public representatives find the confidence to talk down at the poor and vulnerable with conviction that really can only come from believing they are right.
But are averages real? Do average expense costs really reflect what it costs a single person on a low income to live in the UK today?
I’m afraid, I certainly don’t think so. And I’m not going with the idea that because a politician or a public figure says so, it must naturally follow that they are automatically right!
The Real Living Rate
Averages are all well and good. But in my experience, they don’t redirect real life.
So I started all over again and this time, applied the figures that I believe to be accurate as a minimum expense so that I could see just where the real world experience of what it costs an everyday ‘normal’ person lies.
Here is how I did my working:
You’ve probably heard the phrase ‘lies, damn lies and statistics’. (Mark Twain or Disraeli?) And whilst there will always be a need for reliable data, the rather obvious truth is that average data can be completely skewed by just one figure that is disproportionately different to all the others.
However, that difference can very easily be big enough to suggest that the average is very different to what it actually is.
Having studied Statistics at A-Level many moons ago, the wide portfolio of statistical methods available to present data is mind boggling.
But within that spectrum of options also comes the option to use methods which serve the interests of biases of the researcher or whoever is paying for the research, by manipulating the data so that it looks very different to what it really is.
From this standpoint alone, real world experience is likely to be a much better guide. One that demonstrates for factors such as transport costs for a single person, commuting across a city using buses shows the costs of travel are likely to be significantly different to the many others who live in rural areas or even market towns where it cannot be assumed as practical to use a bus as there is limited public transport and normal life requires the use of a car.
Just as important is the reality that costs like broadband and phones aren’t just as simple as a connection and a basic handset.
Today’s culture revolves around smart technology. The reality is that for anyone of working age, limited access to tech means limited access to work – as it does increasingly in every other sense. The argument that nobody needs the latest iPhone simply doesn’t fly – especially when very few people buy them outright and pay an overinflated purchase cost over a period of perhaps 24-36 months.

If you feel prickly about the idea that someone classed as poor is ‘fully connected’, please ask yourself if you would feel disadvantaged if you were to give your phone up?
Finally, and perhaps most controversially, I’ve added what I’m going to call the Pleb Premium at 10%, with this figure representing the extra that people who have very little get charged because of the ‘perceived risk’ that poor people represent (To those who really should know better).
What I found was quite alarming and suggests that the real rate of the National Minimum Wage in October 2023 should be no less than £14 an hour (based on a 40 hour working week)!
More troubling is that in relation to current living standards or rather what is culturally deemed acceptable or even expected, these figures may still be some way lower than what it would take for a single person to support themselves fully, without the need to go into debt or call upon the charity or support of a third party or the benefits system.
And if these figures don’t make you gasp, they probably should.
One of the most challenging phenomena about the current cost of living crisis is the suggestion that people on the average wage – currently just under £28k, cannot afford to buy food.
If you consider that a 40 hour week at £14 per hour, adds up to an annual salary of just over £29k, you will understand that this leaves even the average wage earner over £1000 a year underpaid or £20 a week short.
So, never mind being only £20 a week short. What does it look like if you are expected to be happy that you are being paid the National Minimum Wage at £10.42 per hour for that 40 hour week?
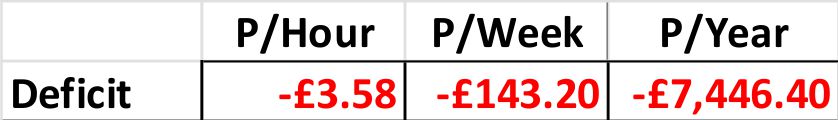
In basic terms, on National Minimum Wage today, set against the figures suggested here, you would be underpaid by £3.58 per hour, £143.20 per week, or by £7,446.40 per year.
Go figure.
This Blog has been borrowed from The Growing UK Food Problem, which will be available to read very soon.

12 thoughts on “Did you know that Statistical Averages suggest we need to earn about £9.41 an hour net to live. But the real-world figure is probably £14+?”